Diagnosis
Organic matter
It is the living reserve that holds water and feeds soil biology. Worldwide, human-induced degradation falls mostly on farmland. Organic matter is also stored energy: carbon and carbohydrates the plant fixed from sunlight, which soil microbes turn into humus and nutrients.
FAO, SOLAW 2025. More than 60% of that degradation is on cropland and pasture.
True Regenerative · field systems
FieldA living soil that works for you again
We read your soil from your own sample, not from a generic table. The figures on this page are worldwide, with their source. Your farm’s figures come from your soil.
Diagnosis
Microbiology
It tells you whether life is working the material or the soil has stalled. You look at the sample — the tube, the plate or the soil in your hand — not at a catalogue count. Fungi and bacteria live in symbiosis with the root: they receive sugars and return water, minerals and nitrogen.
FAO, State of knowledge of soil biodiversity, 2020. Soils host more than 25% of the world’s biological diversity.
Diagnosis
Minerals
A truck unloads rock dust. Of the plant’s 18 essential nutrients, a healthy soil supplies 15. On each farm, the analysis shows what is in excess, what is missing and what is locked up. The dose doesn’t come from a chart.
FAO, World Soil Day, 2022.
Diagnosis
Compaction
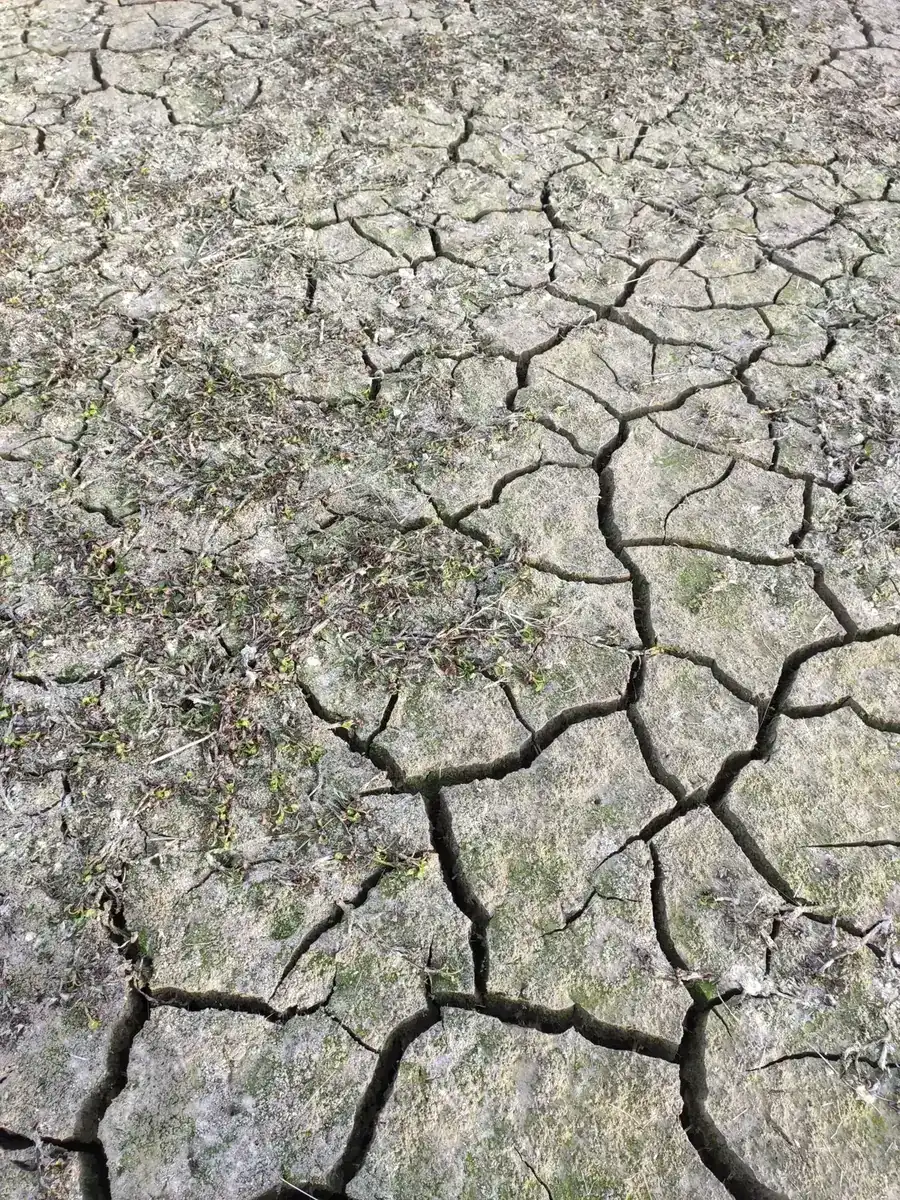
The clod tells you whether air, water and roots can get in or the soil is sealed. You read it in each farm’s profile, and we read it with you in the diagnosis.
FAO, Status of the World’s Soil Resources, 2015. Compaction is among the main soil threats.
Diagnosis
Biodiversity
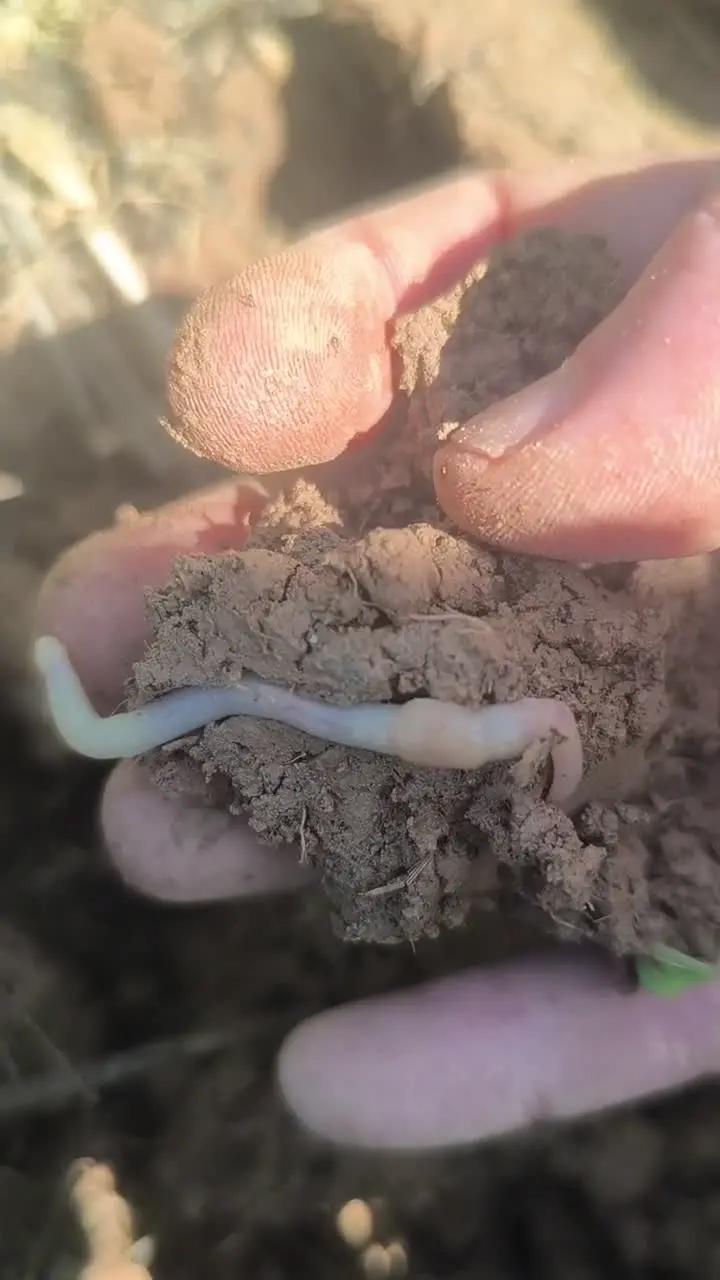
It tells you who lives in that soil. The earthworm is the sign you can see. Indicator plants and insects complete the picture: what grows and flies there on its own shows whether the soil is sealed, waterlogged or out of balance.
IPBES, Global Assessment, 2019. Around 25% of assessed animal and plant species are threatened.
Acid7Alkaline
Indicative scale: the real value comes from the sample.
Diagnosis
pH
pH measures protons; redox (Eh) measures electrons. Together they govern how soil, plants and microbes work.
It tells you whether the soil is more acidic or more alkaline and, with that, which nutrients remain available. For most crops the best range is between 6.5 and 7; below 6, phosphorus is the first to drop. Roots shift the pH of their rhizosphere by 1–2 units.
In calcareous soils, with pH above 8, you cannot lower the pH of the whole soil: the limestone buffers it. There we work on the rhizosphere and organic matter to curb iron chlorosis and phosphorus fixation.
Plant and Soil, 2013 (pH and redox); Plant and Soil, 2003 (rhizosphere).
Reduced·Oxidised
Indicative scale: the real value comes from the sample.
Diagnosis
Redox
It tells you whether the medium is more oxidised or more reduced and, with that, how the soil breathes. When it waterlogs, Eh falls: nitrogen is lost, iron and manganese turn into soluble forms that leach, and methane is produced. Conservation agriculture improves the proton–electron balance compared with conventional farming.
Redox measurements are only reliable with a protocol. That is why each well-made reading counts, not a value copied from a manual.
Advances in Agronomy, 1972 (waterlogging); Analytica Chimica Acta, 2016 (conservation agriculture and protocol).
- pH in water and in CaCl₂
- Eh / rH₂ with a protocol
- Electrical conductivity (EC) and lab analysis
- Same dates every year, for a true comparison
- Rhizosphere versus inter-row soil
Diagnosis
How we measure it
What we do with the data: if Eh is low, drainage or Keyline design. In calcareous soils, organic matter, legumes and banded fertilisation.
Learn more
Next step
Let’s talk about your project
We start by reading your soil. From that assessment, we design and plan the work with you and put it into practice alongside your team. Training and support continue until the team can manage the work independently.